About the Client
The client is a media platform with 150 mln visitors monthly, quite often topping the finance websites rating in the Alexa or Similarweb ranks globally. The platform provides actual news, real-time market data, and other information relating to the financial markets.
Business Challenge
The client was looking for a charting solution as a core of a new analytical B2C system. DXcharts, being one of the leading charting solutions on the market, became a perfect fit for this goal.
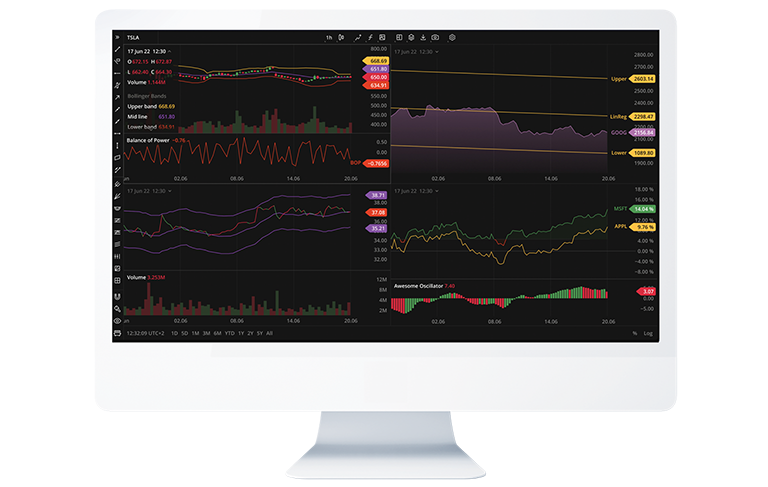
Following the customer needs, DXcharts already provided a comprehensive set of features such as 42 drawings, customizable intervals, 11 chart types, accessibility compliance, etc. Along with the great functionality, impeccable performance was a critical factor to the client: the charting solution had to be working in a high-load environment, a multiple-chart layouts mode, where users launch up to 16 charts at once. It meant that the solution must operate an enormous workload with no productivity or availability loss. None of the then-current market leaders could provide as productive and efficient charts as required.
Solution
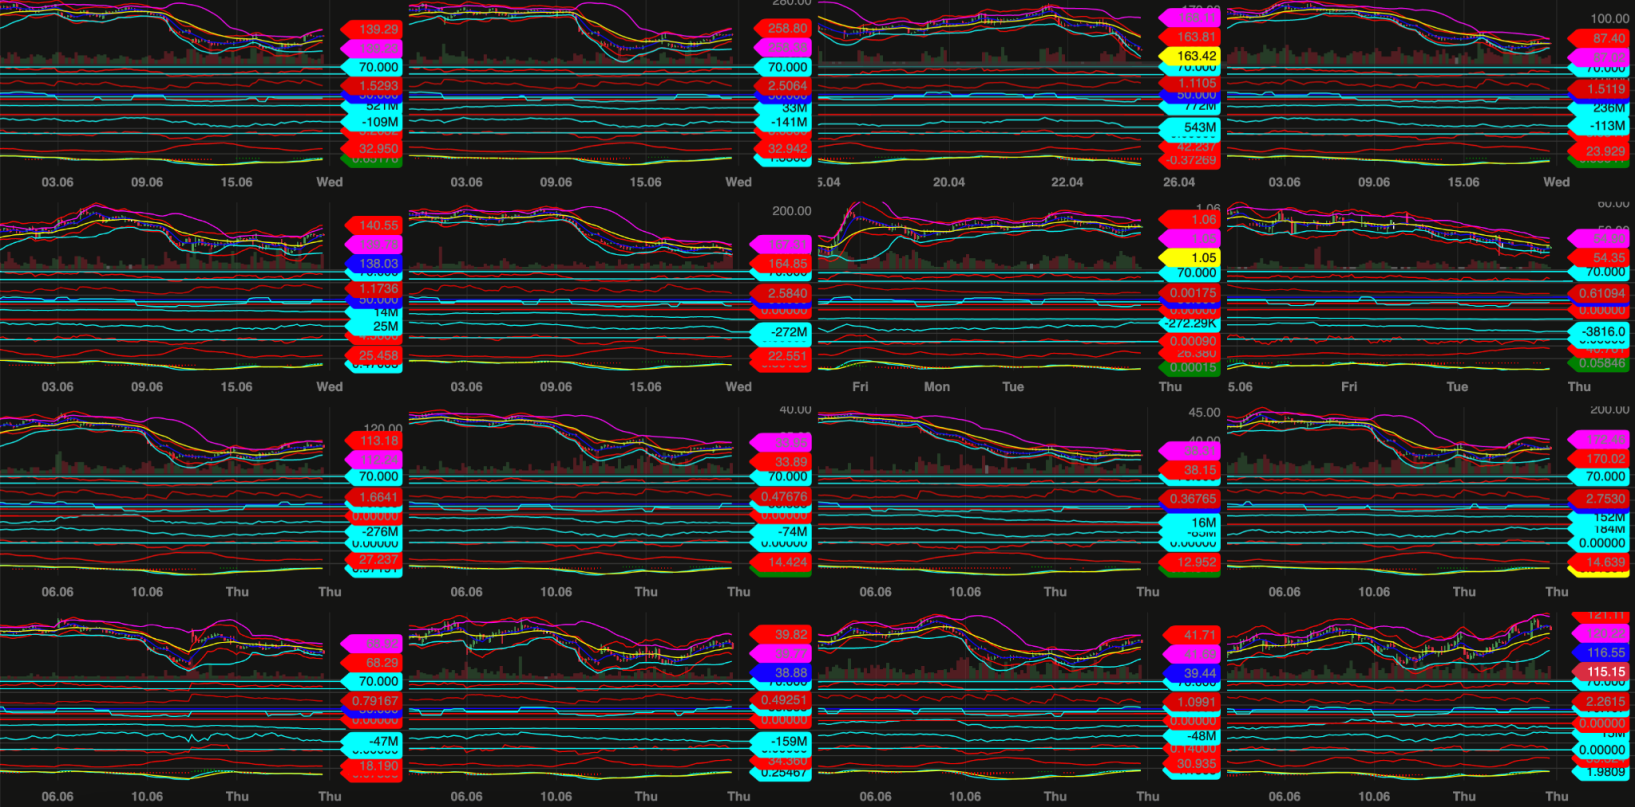
To solve this task, DXcharts team undertook a series of optimization measures. We managed to reduce the CPU usage, increased FPS, and eventually boosted up the DXcharts performance multiple times (see the Results section). The team made DXcharts work smoothly even in high load conditions, such as rendering 8, 12, and 16 charts with market data and indicators updating in real time.
As the final step, we tested DXcharts under extreme workload, employing heavy configuration that would exceed the setups of the most sophisticated users. Devexperts ran the tests several times to ensure that DXcharts will sustain the future performance challenges beyond the project requirements.
Charting is an essential tool in a trader’s toolbox. As a product manager, I always wanted DXcharts to be the best “swiss army knife’’ there is. This project was quite challenging, I would say we unlocked the whole new level: the growing functionality and ease of implementation should now be accompanied by supersonic speed.
It is so delightful to see it through. I truly believe that the users would enjoy it.
Andrey Shuvlenov, Product Manager of DXcharts
I enjoyed working with Devexperts who competed to become our charting vendor. Their team did go the extra mile to satisfy the most demanding requirements of our users – analysts and traders with multi-monitor configurations.
VP of Product, Client Representative
DXcharts Performance Test
The test has been performed on the layouts with 1, 4, 8, 12, and 16 charts.
| Environment | Description | Setup |
| Browser: Chromium 101.0.4950.0 (Developer Build) (x86_64) Hardware: 6-Core Intel Core i7, 32GB RAM Screen resolution: 2048×1280 Test Application: React application which uses only chart-core package to build multi-chart layout | The test compares previous version DXcharts library to the latest version | Quote rate: 10qps (10 price updates per second for each chart) Test duration: 5 sec Total runs: 15 Applied studies: Volumes, MACD, Relative Strength Index, STARC Bands, Bollinger Bands, Average True Range, Aroon Oscillator, Average Directional Index, Accumulation/Distribution, On Balance Volume, Momentum |
Results
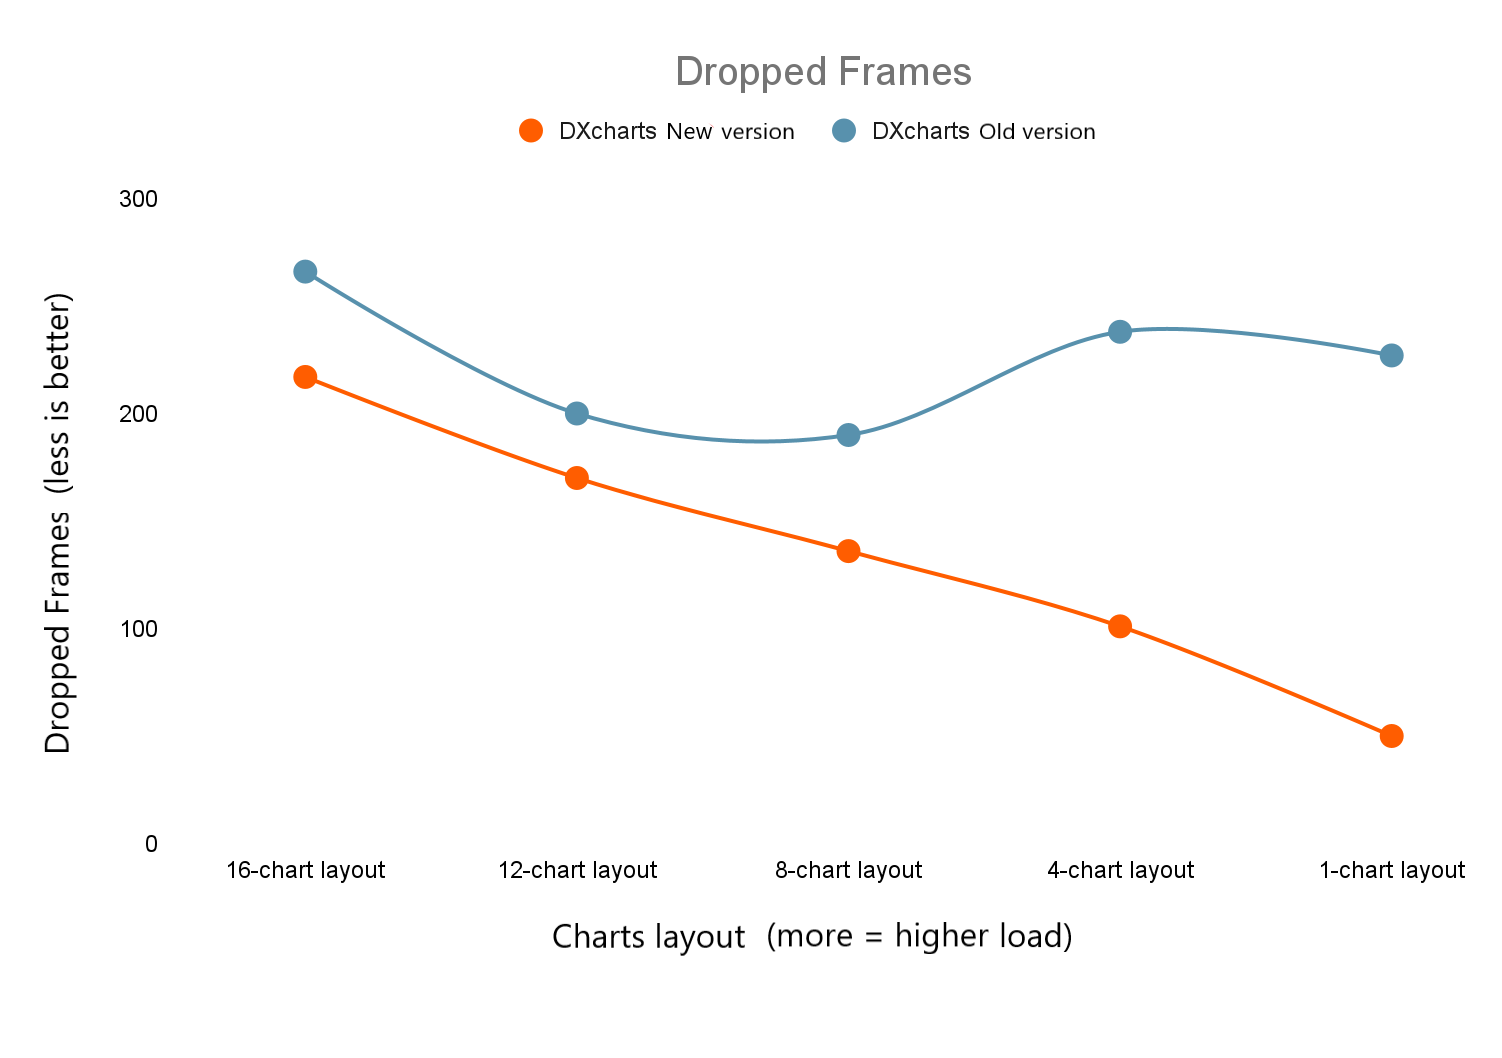
The result is a significant difference between the previous (DXcharts v 3.6.1) and the current version (DXcharts v 5.x.x).
Take a look at the tables below for details.
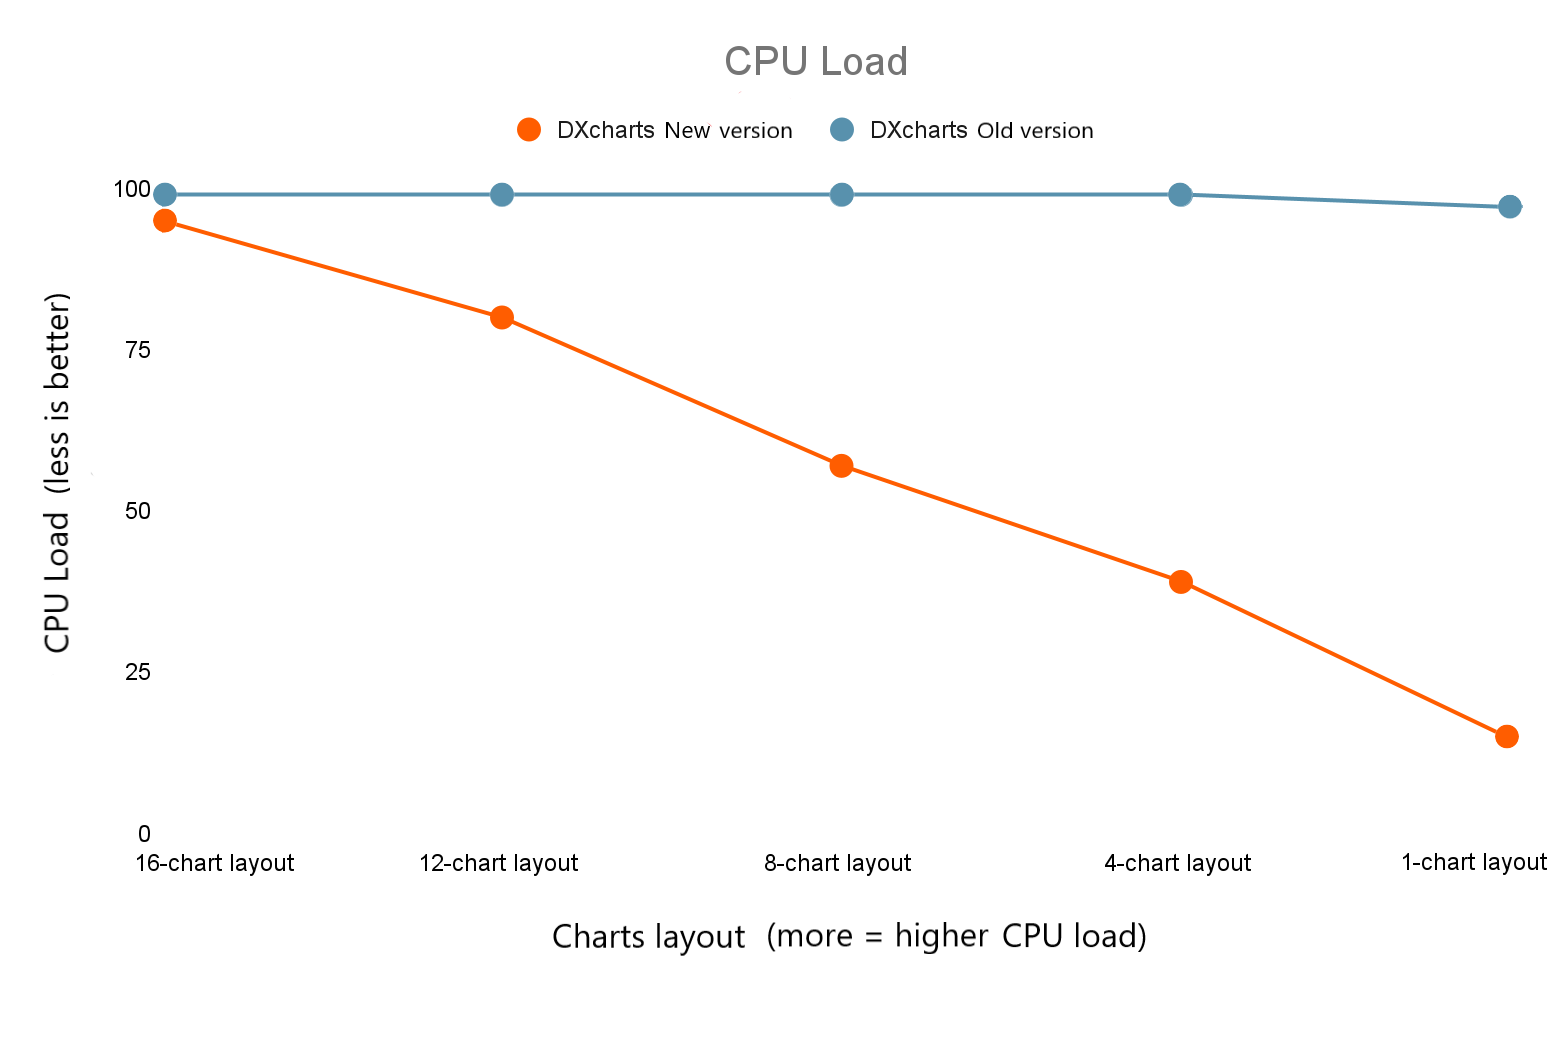
CPU Usage. Current version of DXcharts requires fewer CPU resources across all the test scenarios than the previous version.
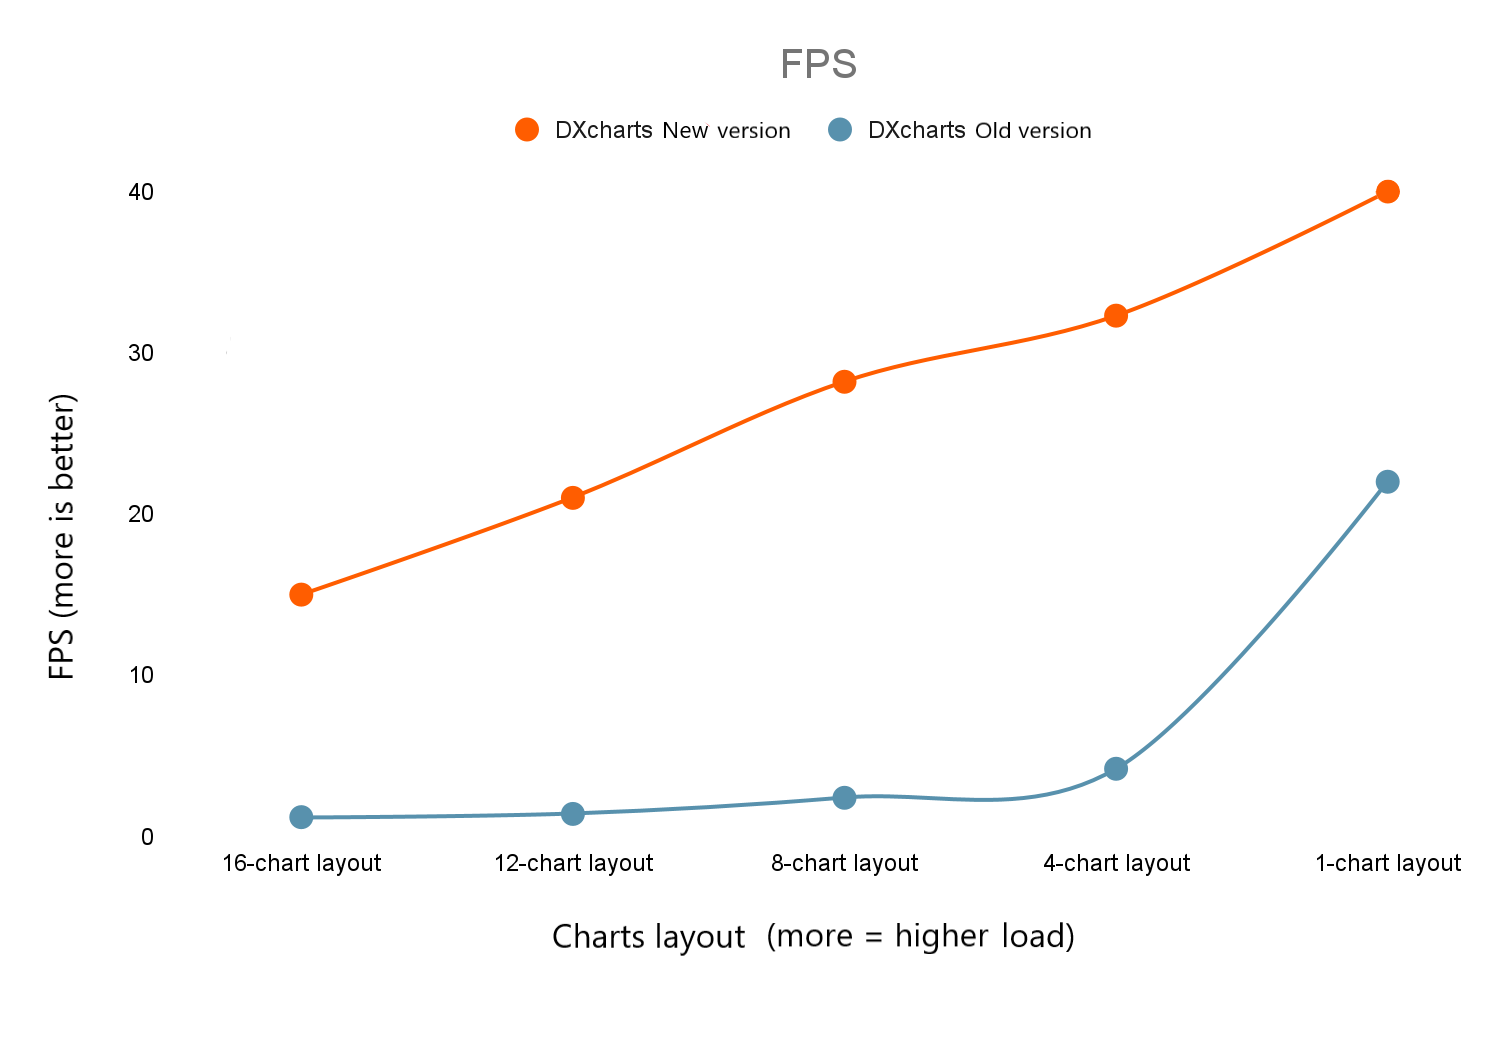
FPS. Current version of DXcharts shows more FPS with fewer frame drops across all the test scenarios than the previous version.
CPU Load
| DXcharts Current Version | DXcharts Previous Version | |
| 1-chart layout | 14% | 97% |
| 4-chart layout | 39% | 99% |
| 8-chart layout | 57% | 99% |
| 12-chart layout | 80% | 99% |
| 16-chart layout | 95% | 99% |
FPS
| DXcharts Current Version | DXcharts Previous Version | |
| 1-chart layout | 40 | 22 |
| 4-chart layout | 32,3 | 4,2 |
| 8-chart layout | 28,2 | 2,4 |
| 12-chart layout | 21 | 1,4 |
| 16-chart layout | 15 | 1,2 |
The resulting performance shows clearly that DXcharts can be run even on most demanding configurations. Our advanced feature-rich supersonic charting solution, seamlessly implemented into high-load financial platforms and news websites, can cover any client’s needs.
Follow the link to check out the DXcharts performance yourself—https://devexperts.com/dxcharts-demo/.
