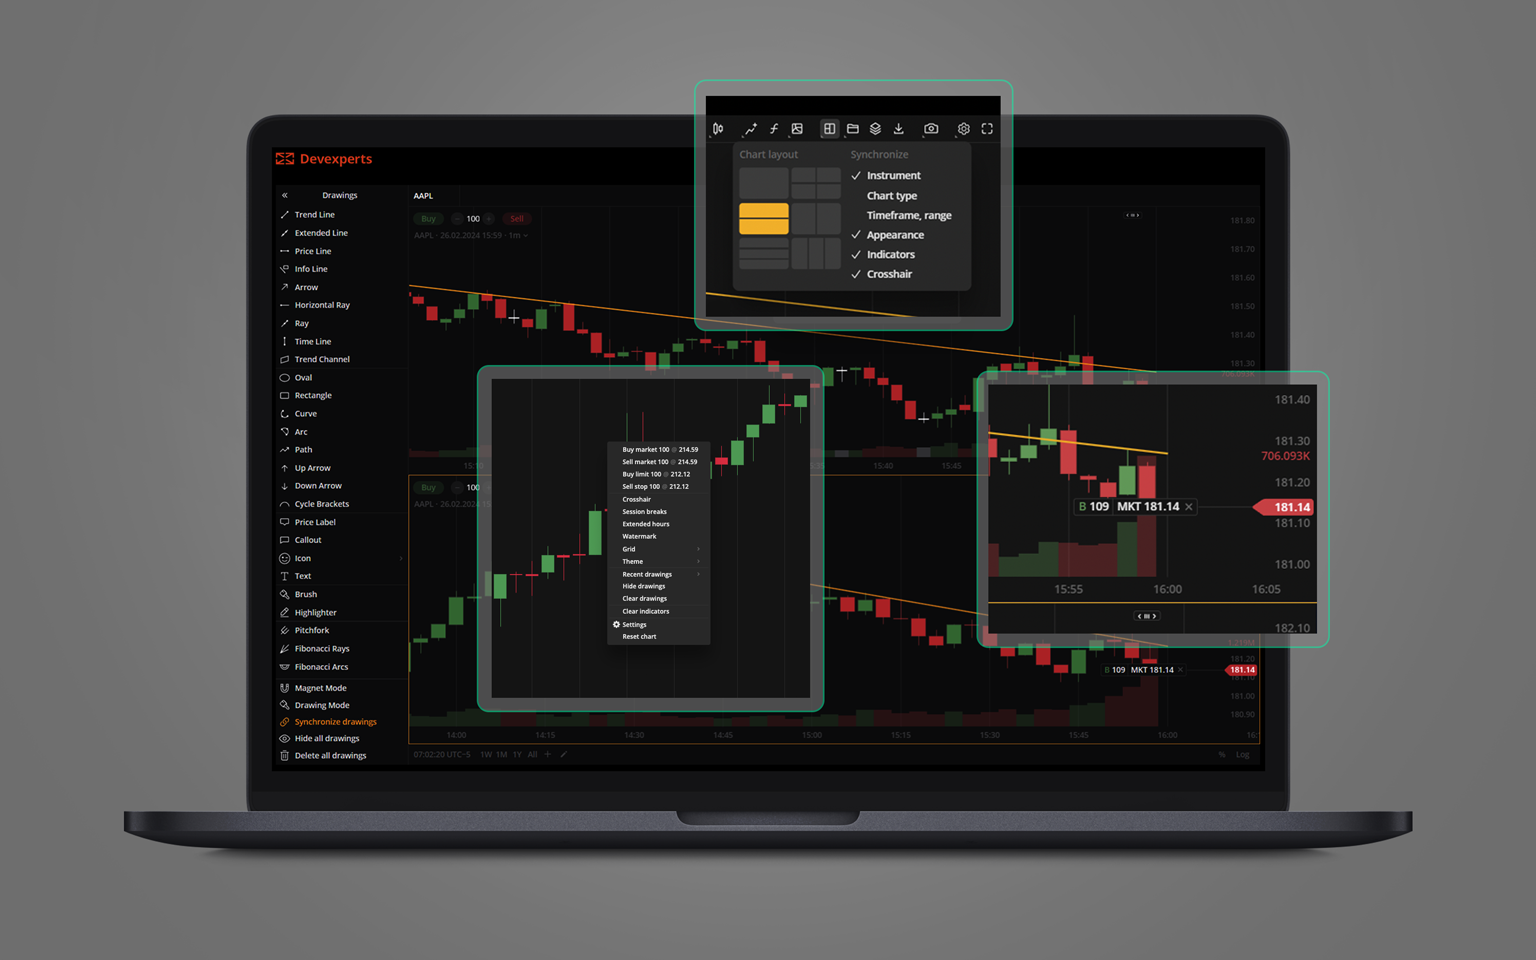
Hello everyone! Let’s dive right into the latest improvements that DXcharts has prepared this time. This update introduces a new feature of displaying execution markers on placed orders as part of Trading from chart functionality, crosshair synchronization and synchronized drawings in a multichart layout, and the shortcut menu that provides quick access to chart settings. Read on for more details!
Execution Markers for Trading from chart
As an addition to the Trading from chart functionality, we’ve now included the ability to display information about executed orders directly in the charting area. Traders can view labels or markers next to their executed orders and select their preferred display method. Each label displays Buy or Sell side, amount of the asset, and the order’s execution price.
To activate the execution markers, you should enable Trading from chart first. Once this is done, go to the Chart settings > Trading > Executions.
There are two ways to display the execution markers:
- Bubbles – the label appears when you hover over the execution marker on the chart.
- Labels – the label itself is displayed right next to the execution marker.
This feature helps you visualize the order executions and provides a clear and concise way to track your trading activity directly on the chart.
Crosshair synchronization and Synchronize drawings in a multichart layout
Crosshair synchronization
Crosshair synchronization is an additional setting for the multichart layout. It becomes available when a user enables several charts at one screen at a time. To enable this, go to Multichart on the Toolbar and select Crosshair in the Synchronize column.
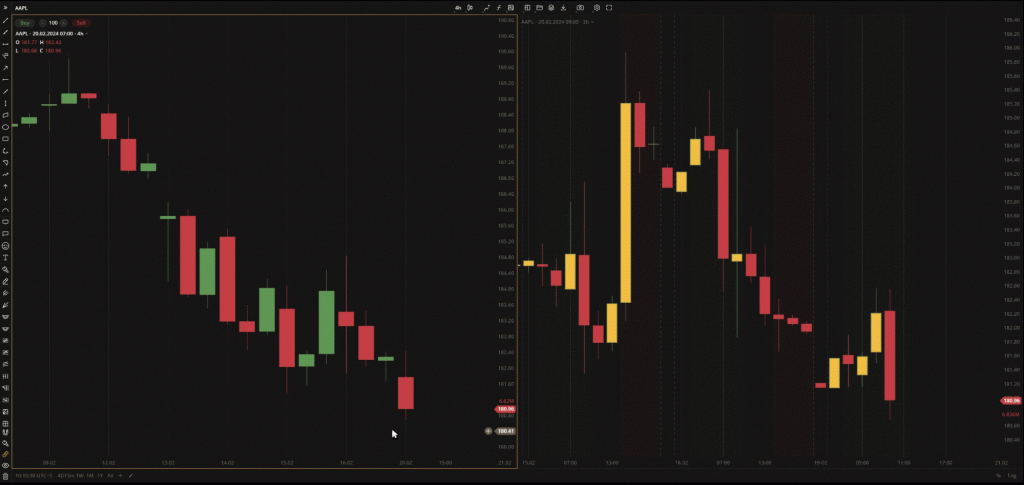
Once the setting is enabled, the crosshair then moves across all the charts simultaneously. It can be useful on a multichart setup to streamline your trading workflow and maximize efficiency.
Synchronize drawings
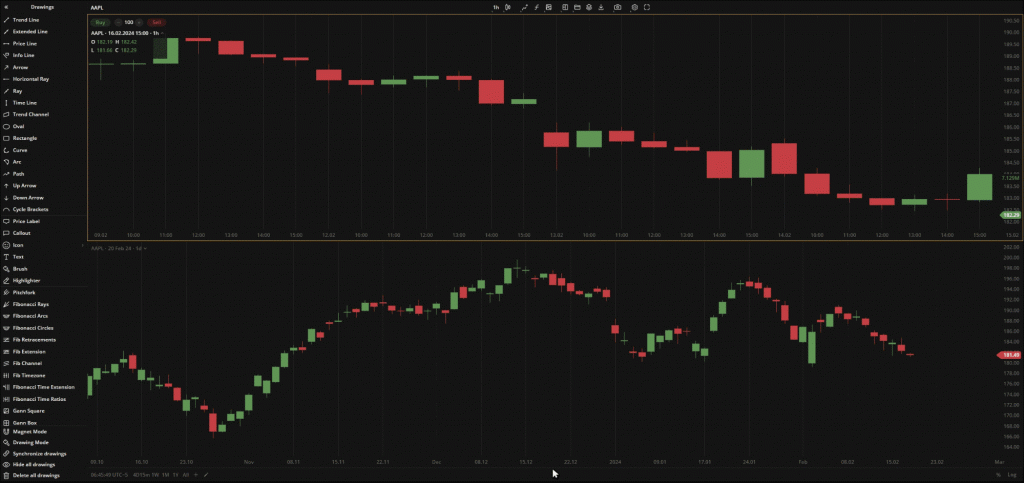
Similar to crosshair synchronization, Synchronize drawings allows you to perform actions on all charts at the same time. In short, It turns on/off the ability to draw on all charts at once when a multichart layout is active.
To enable this feature, expand the Drawings panel and select Synchronize drawings at the bottom of the list.
When dealing with different aggregation periods of the same asset, you can highlight certain data points or trends to emphasize them across all charts simultaneously, comparing the contrast of different timeframes.
Shortcut menu
The shortcut menu, like a Swiss army knife, has been equipped with the trading functionality, and it now also has all the important chart-related settings. Try it for placing orders directly from the chart – it has the essential toolkit for placing Market, Limit, or Stop orders, along with additional Stop Loss or Take Profit orders to manage risk.
By clicking on any chart element, such as candles or bars, you can swiftly toggle between available chart types, select a price type for the chart prices to be based on (Last, Market, Bid or Ask), and adjust chart layering if you’re in Compare charts mode with multiple charts on the charting area.
We hope you’re excited to try out the new features offered by DXcharts! Whether you’re sticking to fine-tuning long-term investments or navigating the intricate webs of day trading, our platform is designed to support complex trading strategies with precision and ease.
Keep your strategies sharp, your trades smarter, and…
Stay tuned,
The DXcharts team


